 K3N8H
K3N8HAd Spend & Margin Insights
Feed it a campaign CSV, get a ROAS chart and a plain-English write-up.
Takes an ad campaign CSV (spend, units sold, price, cost) and produces per-product ROAS and net profit, a chart flagging products below a reference ROAS, and a written summary.
Preview
Open full preview →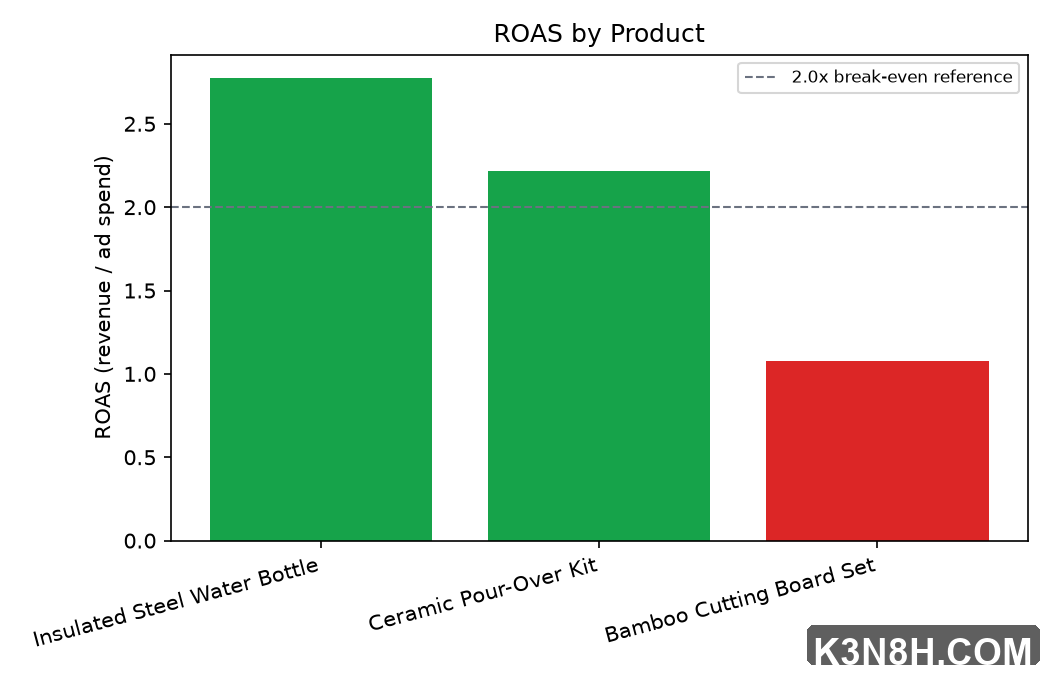
Real chart generated by running the script against the bundled sample-campaigns.csv.
What's included
- ad_spend_insights.py + requirements.txt
- sample-campaigns.csv
- roas_chart.png (real generated chart)
- example-insights.md (real generated write-up)
- README.md with stated input/output limits
See example-insights.md and roas_chart.png — both generated by actually running ad_spend_insights.py against sample-campaigns.csv.
License & pricing
Personal License
$35
For your own use on a single project. No resale or redistribution.
Commercial License
$89
Use across client work or resell the output. No reselling the source files/template itself.
Data Analyst Bots — publishing standard
- Required deliverables: Sample dataset, Example output, Setup instructions, Stated input/output limits
- Disclaimer required
- README required
- Proof-it-runs evidence required
No fabricated capabilities. State real limits on input size/format and output types.
More from E-commerce / Dropshipping
The 7-Day Product Launch Checklist
Validate and launch a new product before spending on ads — day by day.
Product Description Bot
Product facts in, store-ready listing out — always includes an honest shipping-time line.
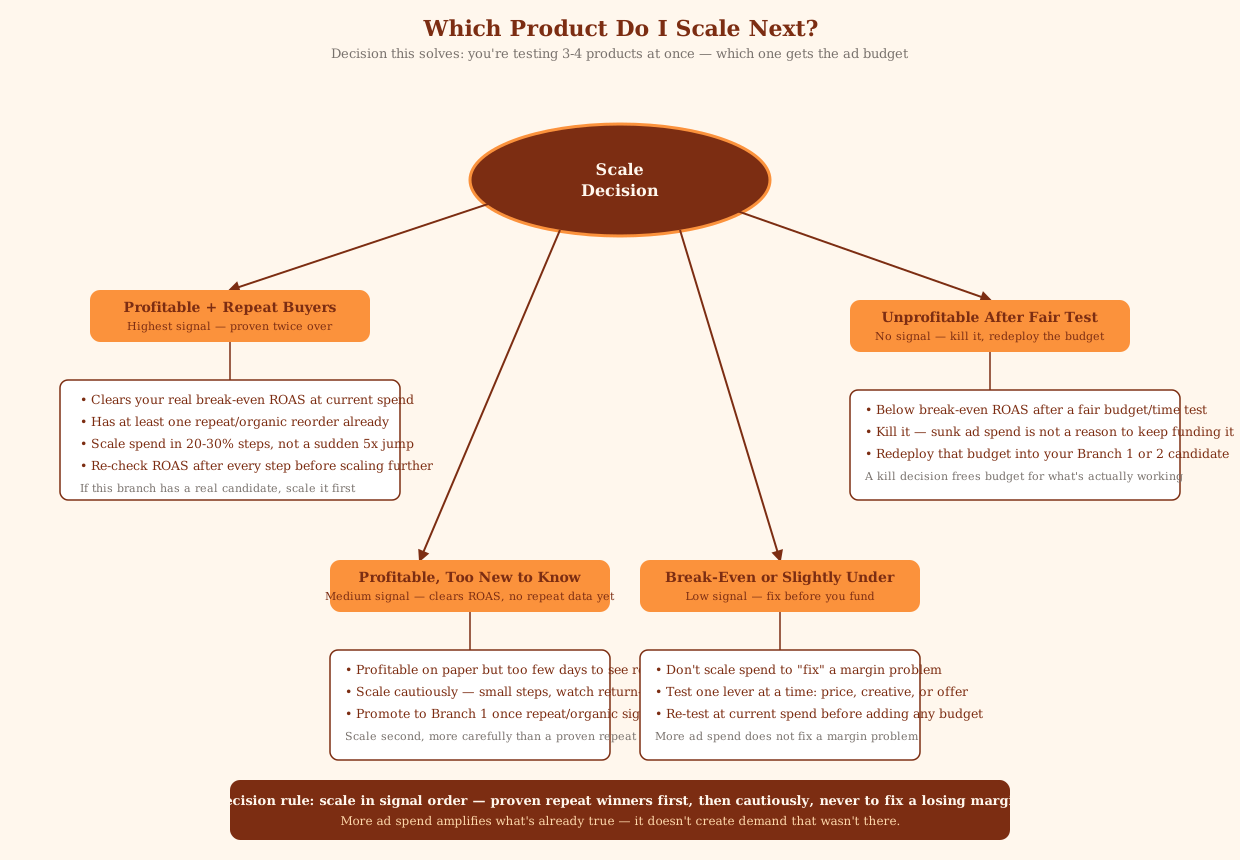
Which Product Do I Scale Next?
Answers one stuck decision: which of your 3-4 test products gets the ad budget.